Phase diagrams for quaternary salt solutions
Phase diagrams for two quaternary salt solutions are shown in the tabs below. This type of phase diagrams are for example useful when designing fractional crystallization processes.
- The sodium chloride, potassium chloride, calcium chloride – water system. This is a system with three cations and one anion which can be plotted in a triangular Jänecke diagram.
- The sodium chloride, potassium chloride, sodium sulfate, potassium sulfate – water system has two cations and two anions and is therefore plotted in a quadratic Jänecke diagram
The sodium chloride – potassium chloride – calcium chloride – water system
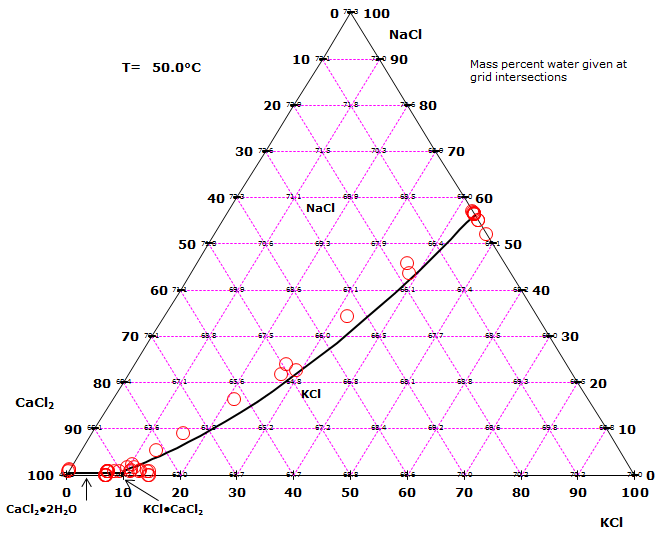
In the quaternary (Na+,K+, Ca2+) – Cl–-H2O system at 50°C, the following solid phases appear:
- NaCl (halite)
- KCl (sylvite)
- CaCl2·2H2O (sinjarite)
- KCl·CaCl2 (chlorocalcite, baeumlerite)
In the triangular diagram shown in the figure to the right, compositions are shown on a dry basis. At any point in the diagram, the mass percents of the three salts NaCl, KCl, and CaCl2 add up to 100%. A saturated solution contains the amount of water given in mass percent in the diagram and an amount of salt with a composition corresponding to the location in the diagram.
The experimental points and the calculated phase diagram lines represent compositions at which two solid phases are in equilibrium with the same saturated liquid. Each field in the diagram represents solution compositions that can only be in equilibrium with a single solid phase. The two fields representing CaCl2·2H2O and KCl·CaCl2 are very small. This is indicative of a high solubility relative to the other salts in the diagram.
The aqueous sodium chloride – potassium sulfate reciprocal salt system
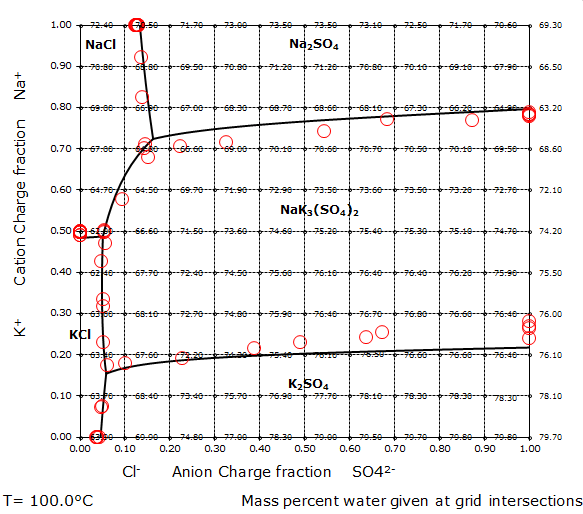
In the quaternary (Na+,K+)-(Cl–,SO42-)-H2O system at 100°C, the following solid phases appear:
- NaCl, Sodium chloride
- Na2SO4, Sodium sulfate
- KCl, Potassium chloride
- K2SO4, Potassium sulfate
- NaK3(SO4)2, Glaserite
The phase diagram to the right shows the concentration ranges in which the various solid phases appear. The concentration unit is charge fraction, which corresponds to equivalent fraction. The water contents of the saturated solutions are indicated by the numbers given at the grid intersections as mass percent water.
Each corner of the phase diagram represents a binary solution, and each of the four sides a ternary solution. The lower left corner of the figure to the right represents a KCl solution, the lower right corner a K2SO4 solution. Correspondingly, the upper corners represent a NaCl and a Na2SO4 solution.
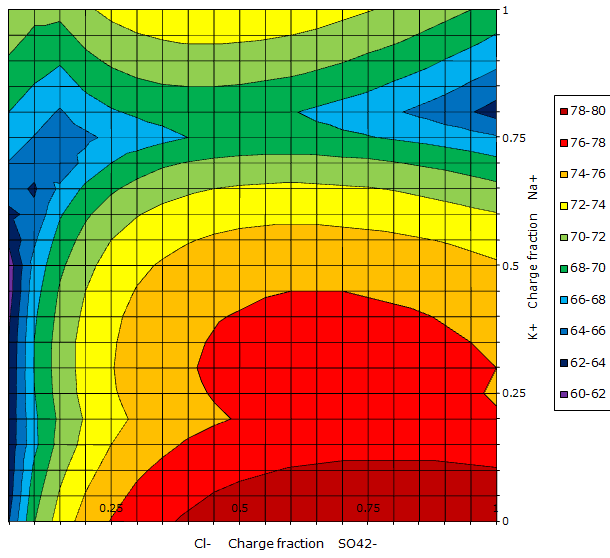
A contour chart of the same system is shown below to the right. This diagram does not show the phase diagram lines, but only the water content in each part of the diagram. The water content is indicated by colors as shown in the legend, where the numbers are mass% water. The brown color indicates a high water content and the dark blue a low water content.
Below to the left is a 3-D plot of the same diagram. It uses the same color scheme as the contour plot to indicate the water level. The phase diagram lines can be seen in the 3-D plot as the lines corresponds to the “valleys” in the 3-D plot. The low water content at the phase diagram lines is indicative of the common tendency of salting in.


